Reporting & Analytics
The insights you need for transformative growth and profit.
Stay on top of your sales funnel, identify your best performers, and know precisely where to focus time on the problems that matter most.
Interactive dashboards provide clarity and insight into what’s working and what’s not so you know where to lean in and what to fix.

How it Works
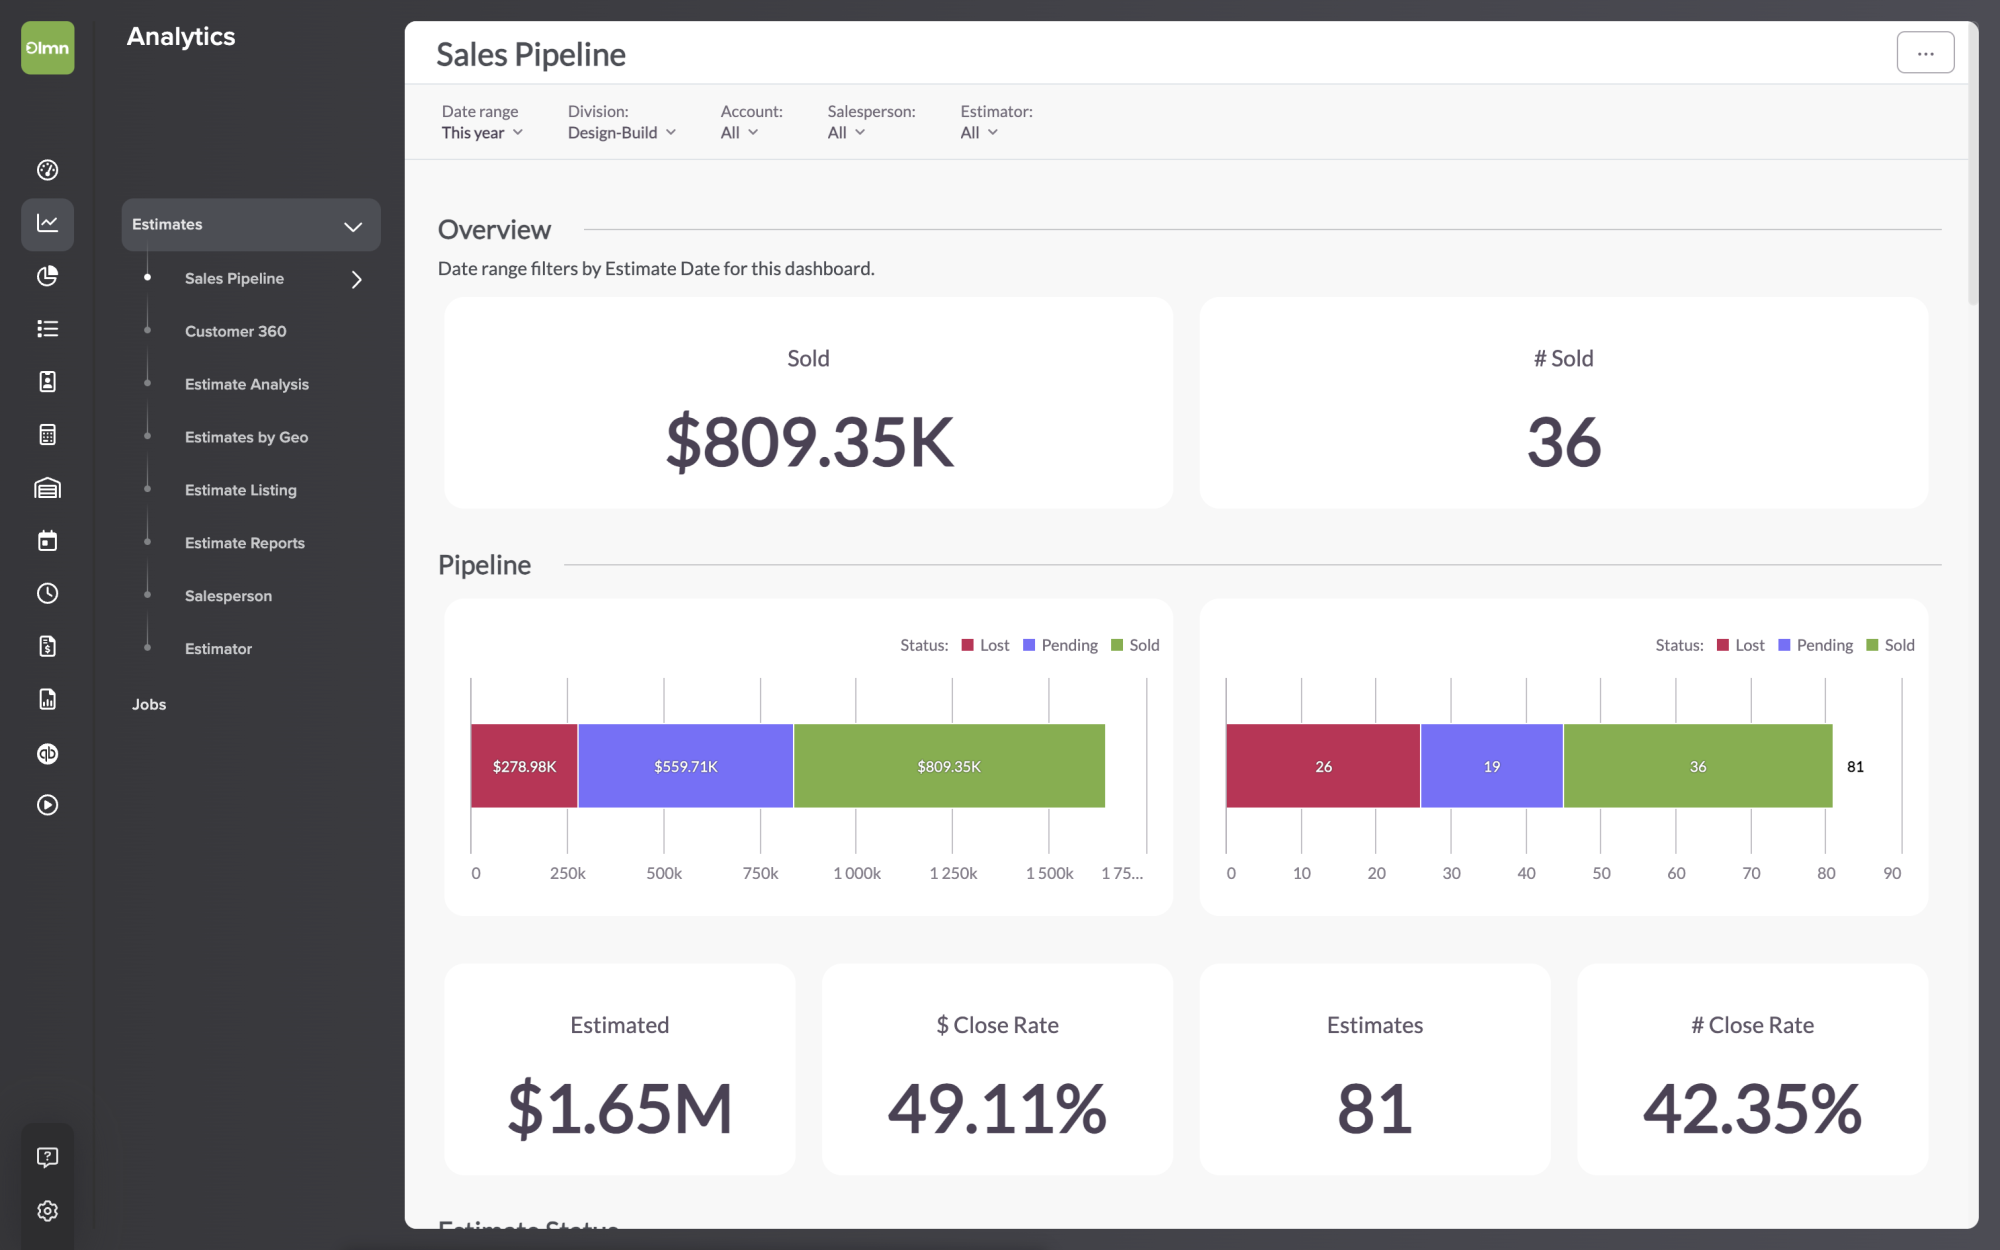
1 Study your sales pipeline, staff effectiveness, job costing, and more.
Take control of the wheel – LMN’s analytics visually show you exactly what (and who) is driving success, what needs attention, and where your bottlenecks are.
Sophisticated report filtering gives you the ability to instantly slice and dice your graphs by division, by salesperson, by job group, by crew lead, and so much more.

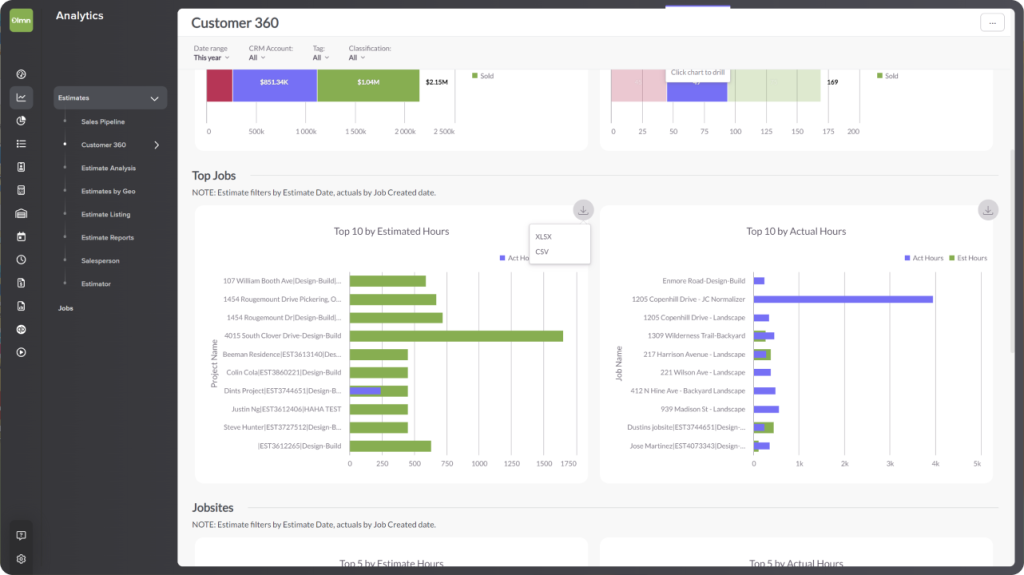
2 One click to drill into detailed insights.
See the data behind the picture – Want to understand why a graph is trending the way it is? Simply click on the graph, or part of the graph, to see the detailed numbers behind the picture.

3 Export to PDF or Spreadsheet.
Want a good-looking report suitable for presentations, meetings, or staff reviews? The PDF export has your back.
Want to drill into more detail, add your formulas, or import the data into another system? You can export any graph to XLSX or CSV.
See Analytics in Action